Immuno-Oncology Clinical-Trial Pipeline
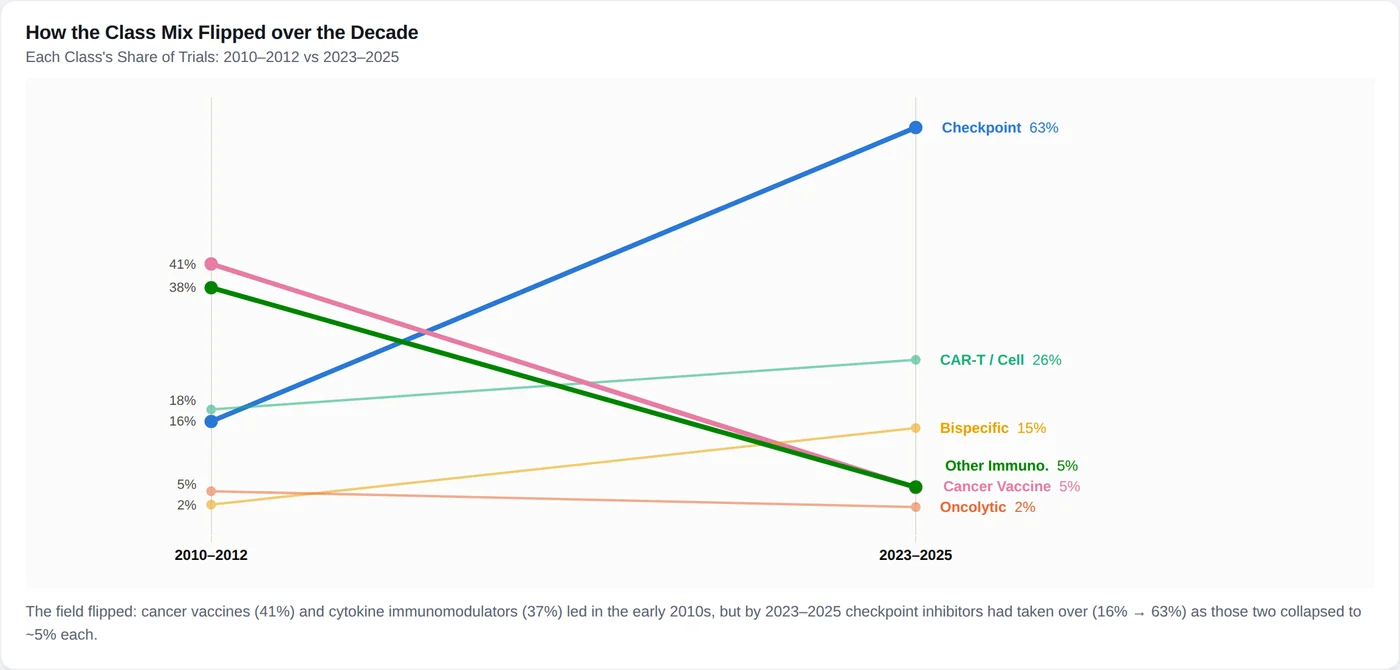
A self-directed pipeline over the ClinicalTrials.gov registry — 26,714 records distilled to 10,971 immuno-oncology trials — answering where cancer-immunotherapy development is concentrating, with the classifier behind the answer validated three independent ways.
The problem
Every other project in this portfolio runs on the course dataset. This one I chose and framed myself: which therapy classes, phases, and sponsors are crowding the immuno-oncology pipeline, and how has that shifted over the decade? The obstacle is that trial registrations don't say which therapy class they belong to — the signal hides in messy titles, intervention names, and company code names like "MK-3475" that reveal nothing unless resolved. Any answer is only as good as the classifier that produces it, so most of the engineering went into proving the classifier could be trusted.
Approach
- Pull interventional cancer-immunotherapy trials from the NIH/NLM registry — 26,714 raw records — and restrict to a clean 2010–2025 analysis window with a written funnel accounting for every drop.
- Tag each trial into six canonical therapy classes with a controlled-vocabulary classifier, backed by an NCI-Thesaurus resolution layer that translates company code names into their generic identities.
- Validate three independent ways: a 580-trial sample graded by three human labelers, a leakage-clean audit of the trials the pipeline dropped, and a full-corpus re-tag by an independent LLM labeler.
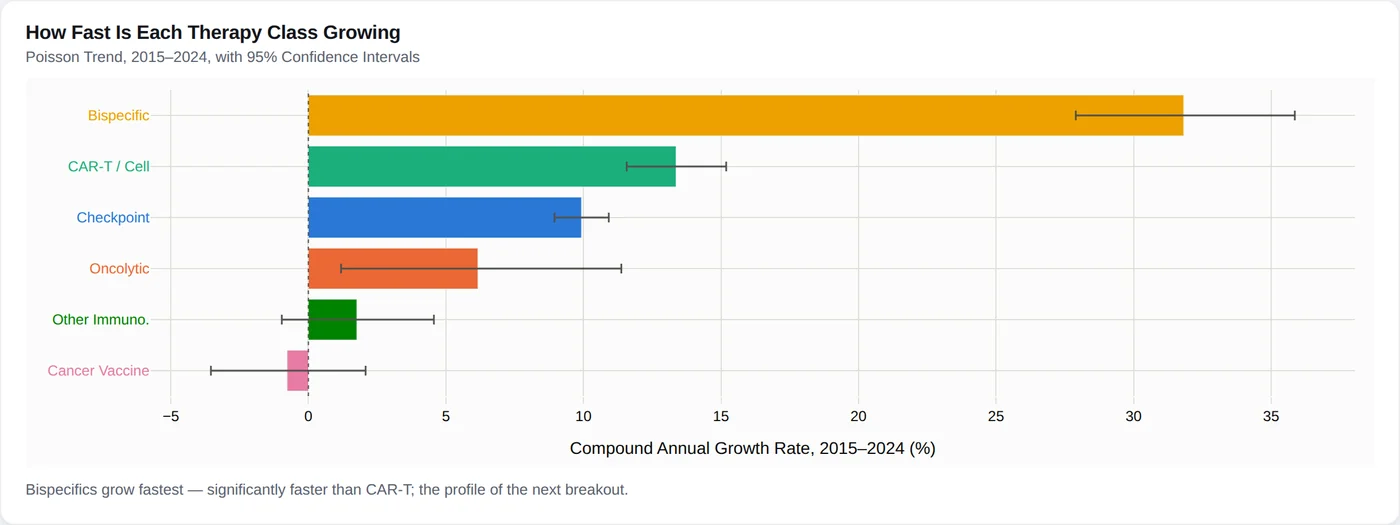
- Build the analysis on top — Poisson growth trends with confidence intervals, Holm-corrected country comparisons, FDA-approval timelines — and publish it as figures plus the interactive dashboard linked above.
Challenges
Company code names hid whole therapy classes. A trial testing "MK-3475" is a checkpoint-inhibitor trial, but no vocabulary of generic drug names can see that — early counts silently undercounted exactly the classes with the most industry activity.
How I solved itAdded an NCI-Thesaurus resolution layer that maps code names to canonical agents before classification. After it, the vocabulary's counts converged with the independent LLM re-tag — checkpoint 7,000 vs 6,993 — instead of trailing it.
No ground truth existed to score the classifier against — the registry has no therapy-class field, so accuracy claims would have been circular.
How I solved itBuilt the ground truth: three independent labelers graded a 580-trial sample (inter-rater Fleiss' κ = 0.97), and the classifier was scored against their consensus with per-class precision and recall reported with confidence intervals — 0.969 / 0.981 on the largest class.
The dropped trials could hide the story. If the 8,318 records excluded from the window contained six-class trials the vocabulary missed, every downstream number would be biased, and no in-sample metric would ever show it.
How I solved itAudited a 360-trial sample of the drops under the same blinding as the main validation: 10.8% were genuine misses (CI 8.0–14.5%), reported by class in the writeup rather than left as an unknown.
One method, one blind spot: any single classifier — rules or LLM — fails in systematic ways its own metrics can't reveal.
How I solved itRan a second, fully independent method: an LLM re-tagged all 19,230 classified trials from the same class definitions. The two methods agree at mean Cohen's κ = 0.79 with 85% exact class-set agreement, and their disagreements flagged the weakest class definitions.
Measuring what the classifier missed
In-sample metrics cannot see the trials a pipeline discarded. If the 8,318 dropped records held six-class trials the vocabulary failed to recognise, every downstream number would be biased and no accuracy score would reveal it. So the drops were sampled and graded under the same blinding as the main validation, and the miss rate published with a confidence interval.
AUDIT_N = 360          # sample of the trials the pipeline dropped
CONF = 0.95

def audit_dropped(dropped, labels):
    """Estimate end-to-end recall from a blinded sample of the drops.

    Returns the share of dropped trials that were genuine six-class
    misses, with a Wilson interval — an interval, not a point estimate,
    because a sampled rate reported bare invites false precision.
    """
    sample = dropped.sample(AUDIT_N, random_state=SEED)
    verdicts = [labels[t] for t in sample["nct_id"]]
    missed = sum(v != "not_io" for v in verdicts)
    lo, hi = proportion_confint(missed, AUDIT_N, alpha=1 - CONF,
                                method="wilson")
    return {"missed_share": missed / AUDIT_N,
            "missed_share_ci": [lo, hi],
            "audit_sample": AUDIT_N}
Result: 10.8% missed, CI 8.0–14.5% — reported in the writeup by therapy class rather than left as an unknown.
What it looks like
What I took from it
The dashboard is what people see, but the classifier validation is the work I'd defend in a review. Measuring my own pipeline's miss rate — and publishing it with a confidence interval — changed how I read other people's results: a headline number without an error bar on the labeling step is a number I now know how to question. The approval-timeline finding taught the other lesson: the honest claim was a temporal association, not causation, and saying so plainly cost nothing.